
How to read numerical data from experimental image data by using GSYS
Last Update:2025/06/11
1. Abstract
GSYS is a useful software that converts data from graph images into numerical values. It can be used on any platform, including Windows, Linux, and Mac, as long as Java is available. This software is especially helpful for converting graph data from published experimental results into numerical data. Here, we demonstrate an example of data extraction using GSYS 2.4 on a Mac. For detailed instructions, please refer to the English manual.
2. Installation
First, you need to prepare a Java runtime environment (an executable file is also available for Windows if Java doesn’t work properly). If Java is not installed, download and install it from the Java website.
Next, download the latest version of GSYS from the download page. At the time of writing, the latest version is Gsys2.4.9.jar. After downloading, open the MacOS terminal, navigate to the directory where the file is saved, and launch Java.
cd (Directory of Download File)
java -jar Gsys2.4.9.jar
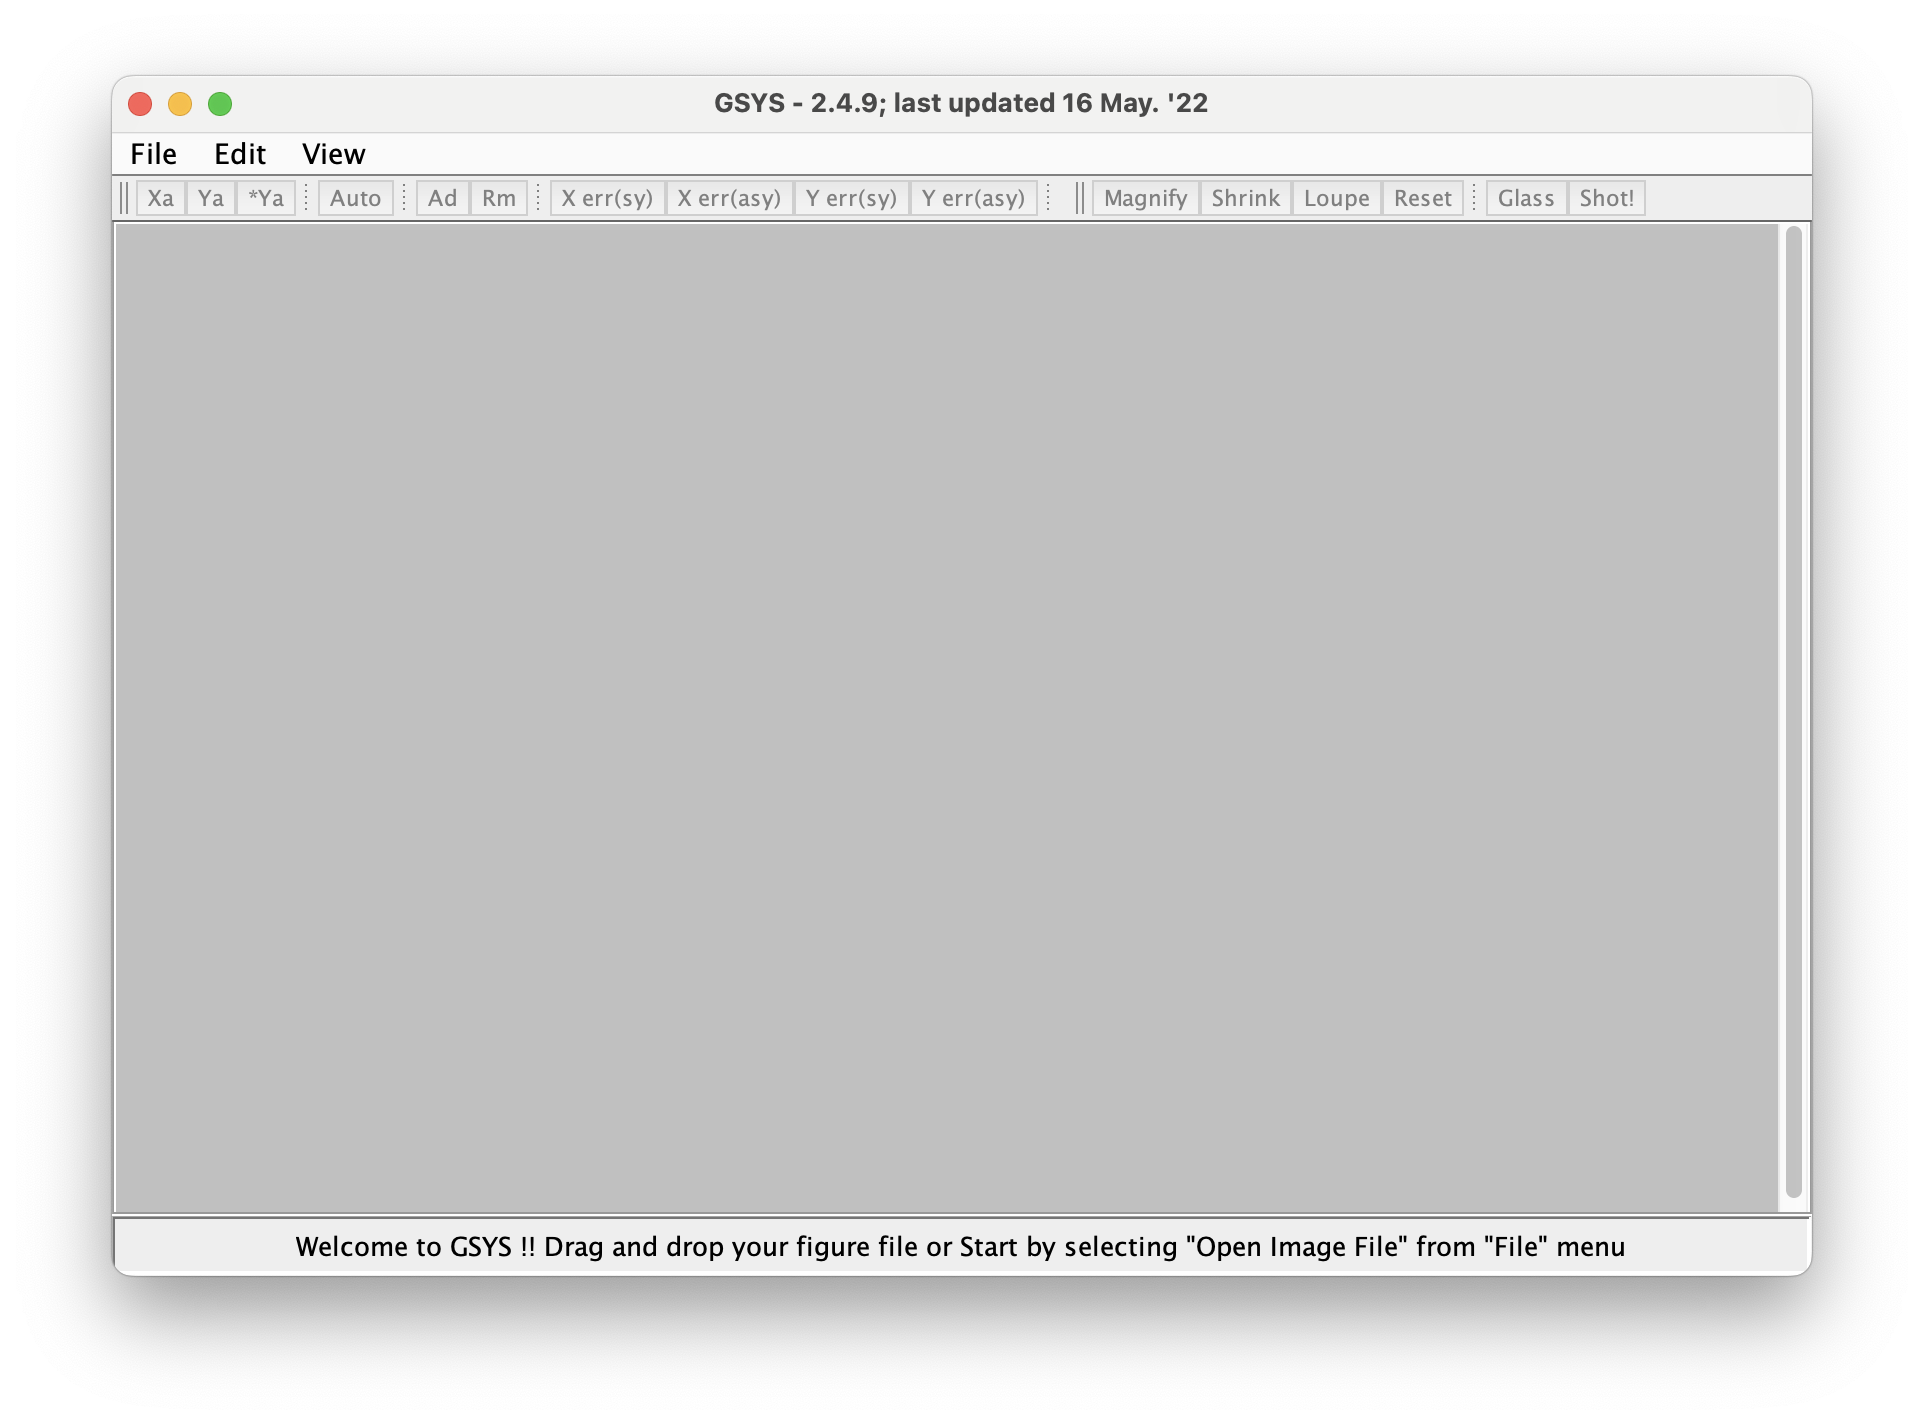
This should launch the following screen.
3. How to Use
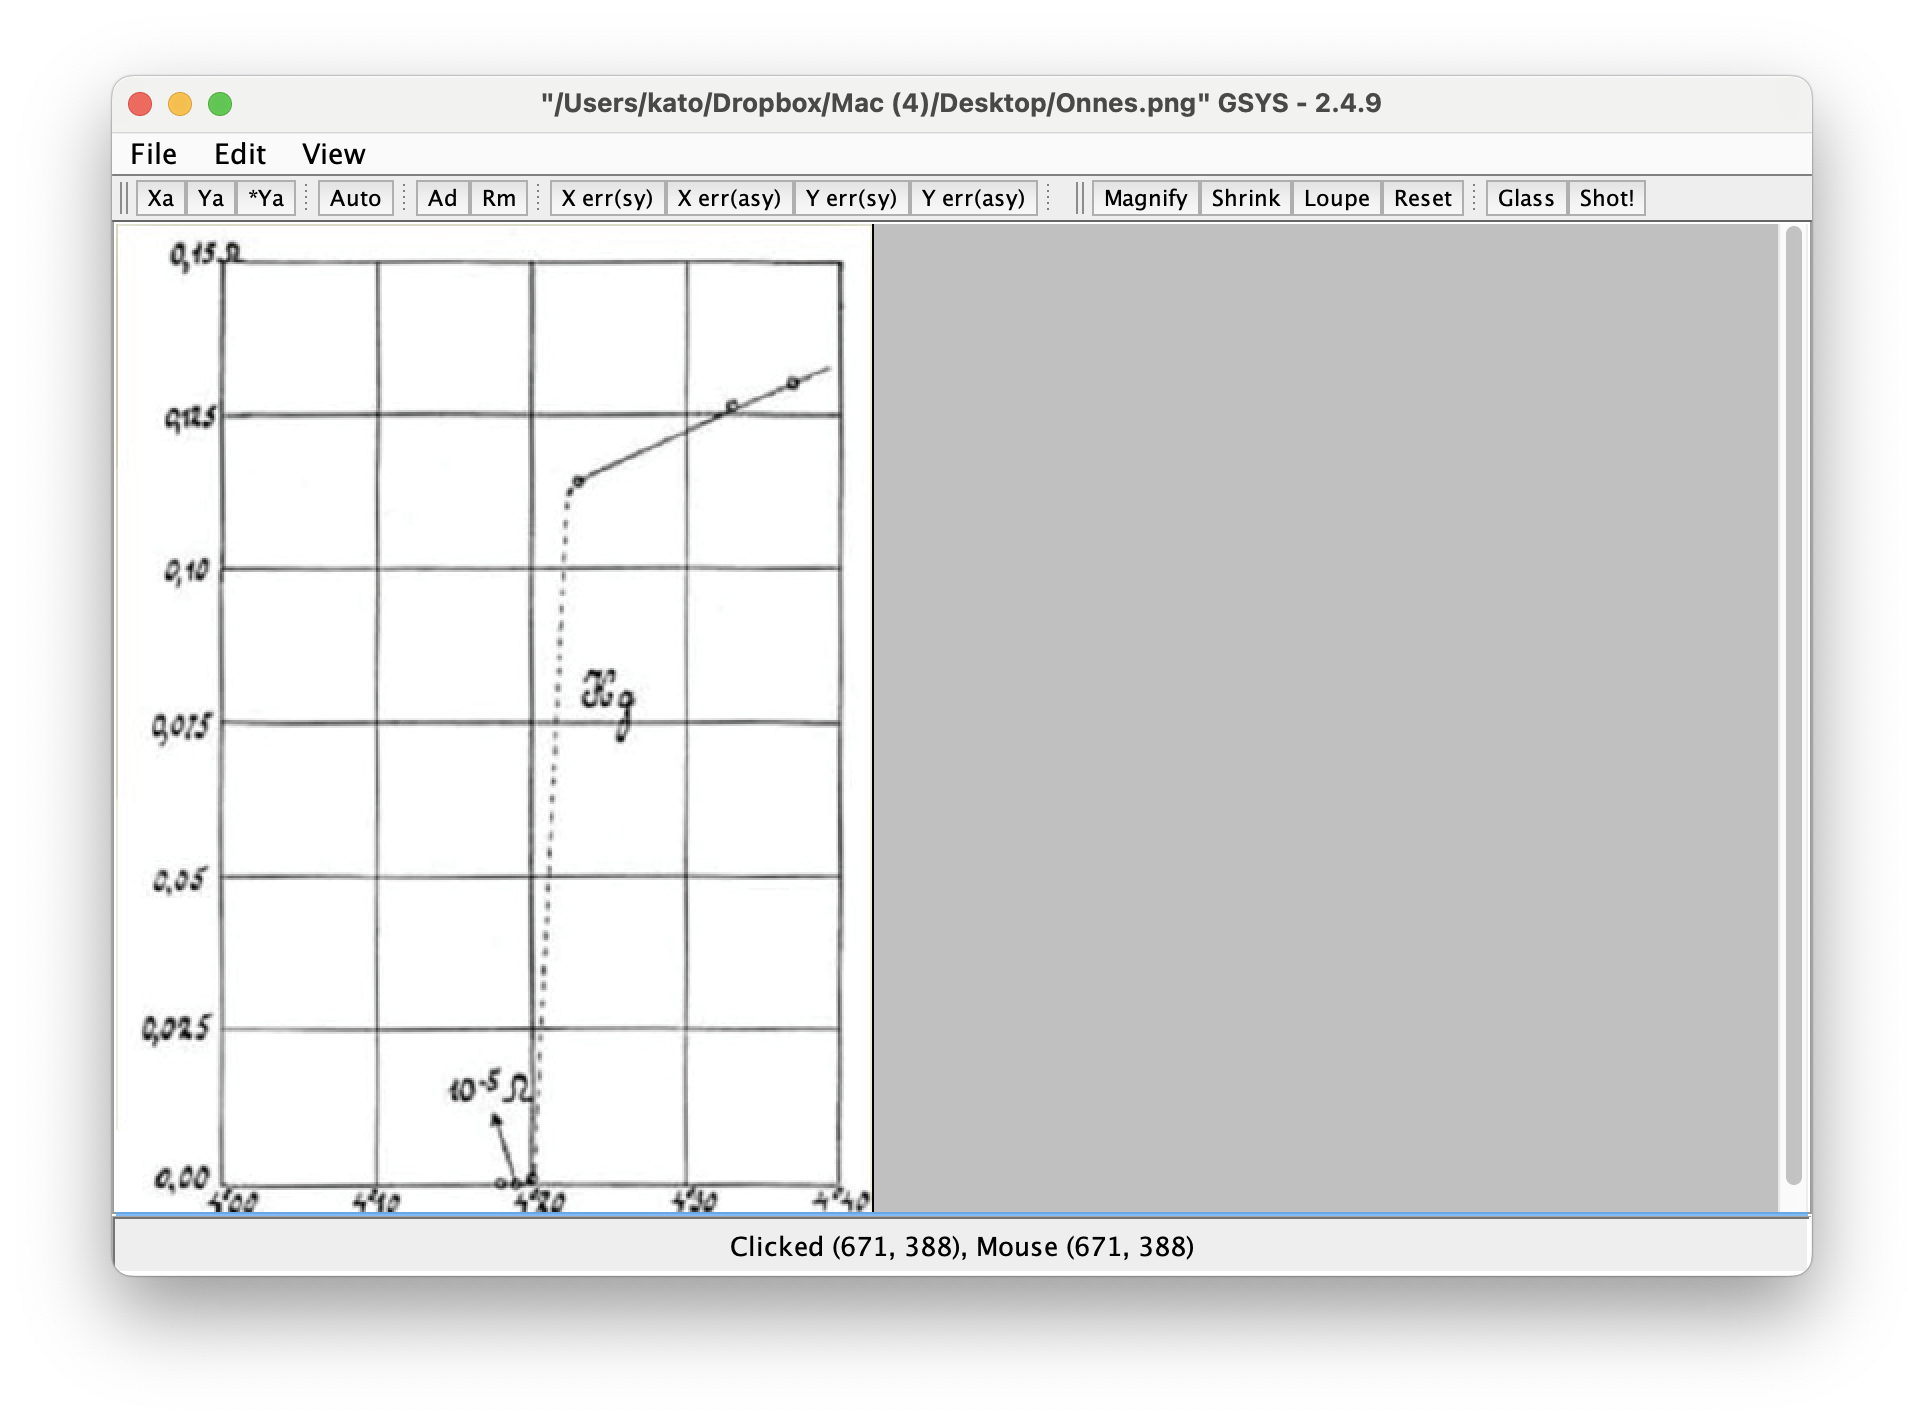
As an example, let’s extract numerical data from a graph of the superconductivity of mercury discovered by physicist Kamerlingh Onnes in 1911 [H. Kamerlingh Onnes, Commun . Phys . Lab . Univ. Leiden 124c (1911)]. Obtain and save the image file, then select “File” → “Open Image File” from GSYS’s menu.
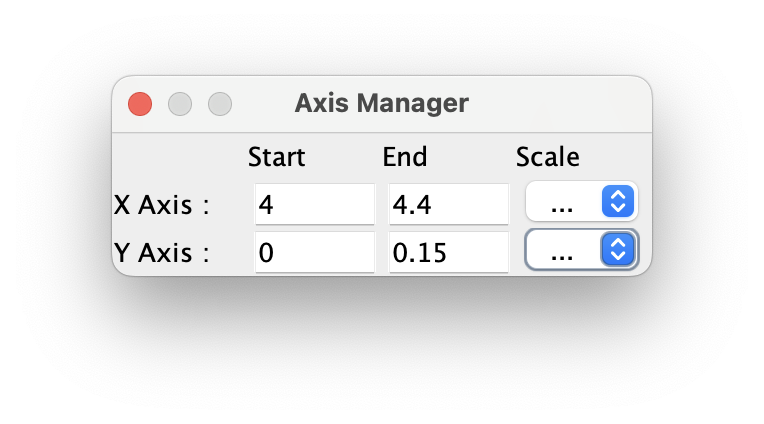
From the small Axis Manager window, input the start and end values for both the X and Y axes. Also, set the Scale to “Linear” for both the X and Y axes.
Next, specify the start and end positions for the X-axis. It’s a good idea to zoom in as much as possible using the “Magnify” button. Press the “Xa” button and left-click the appropriate positions in order, starting with the start point, then the end point. If you need to modify the points after setting them, you can click the point you want to adjust and move it with the mouse.
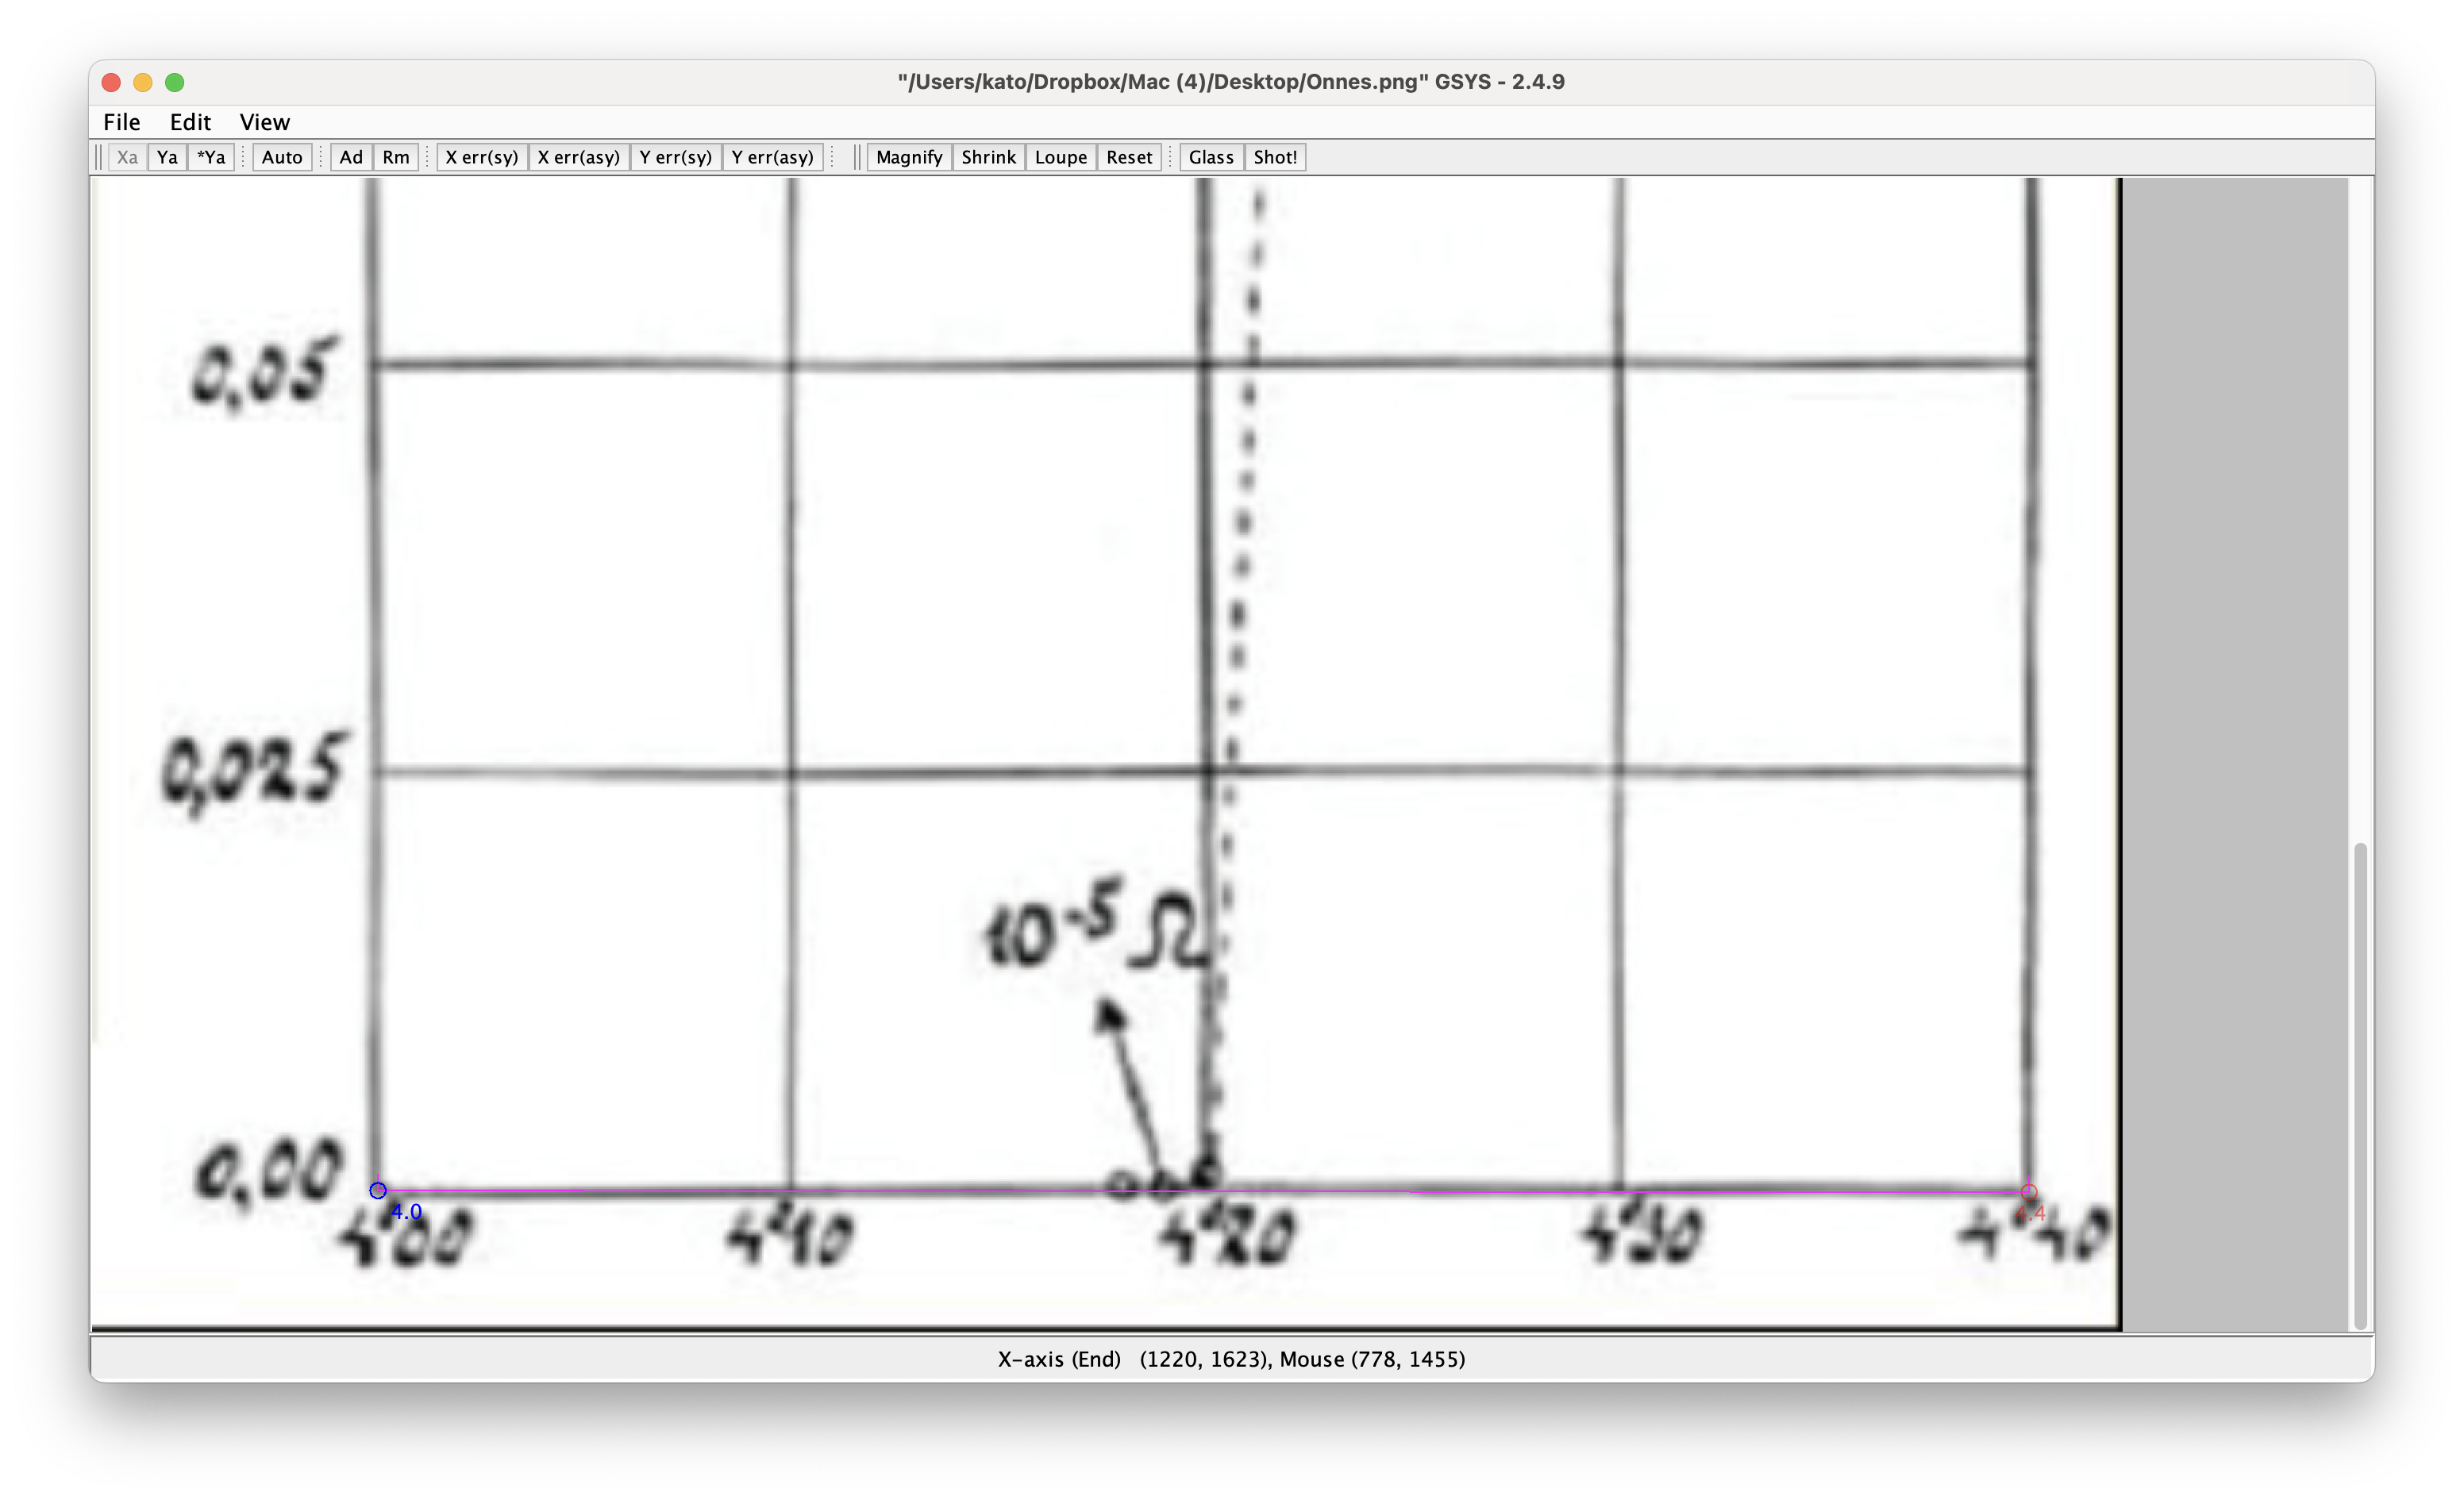
Then, specify the start and end positions for the Y-axis. Normally, press the “Ya” button, but if the start point of the X-axis is the same as that of the Y-axis, you can press the “*Ya” button and only specify the endpoint. In this case, press “*Ya” and specify only the endpoint.
Next, specify the data points of the experiment. Press the “Ad” button and click the positions of the data points with the mouse. It’s easier to work if you zoom in using the “Magnify” button as much as possible.

Now you’re ready to output the numerical data. Open a new window by selecting “File” → “Open Image File” and click the “Write” button to display the numerical data. You can also output the file by pressing the “Save” button.

When you plot the output file using gnuplot, the result looks like this:
