
Drawing cd-Si band structure using VASP and pymatgen
Last Update:2024/12/13
Band structure calculations using VASP involve the following steps:
- Obtain a self-consistent electron density using a uniform k-point mesh.
- Calculate eigenvalues along high symmetry k-point paths using the electron density obtained above.
- Plot the band structure.
This should work with little modification if you are on some Linux server where you can run vasp. The following example works on the Sekirei supercomputer system at the Institute for Solid State Physics, the University of Tokyo.
Obtain a self-consistent density
4 files are necessary for a VASP calculation:
- POSCAR – structure information
- KPOINTS – K-points for Brillouin zone sampling
- INCAR – input parameters related to accuracy, convergence control, etc.
- POTCAR – pseudopotential file; you can access this file once you purchase a VASP license
For cubic-diamond Si, example POSCAR file for the primitive unit cell:
Si2

1.0

0.000000 2.750000 2.750000

2.750000 0.000000 2.750000

2.750000 2.750000 0.000000

Si

2

direct

0.750000 0.750000 0.750000 Si

0.500000 0.500000 0.500000 Si
KPOINTS file for a 4 by 4 by 4 mesh centered on the Gamma point:
4x4x4

0

G

4 4 4

0 0 0
Example minimal INCAR file (the defaults set in VASP are usually rather sensible ones):
ISMEAR =  0

SIGMA  =  0.01

GGA    = PE
We now have input files prepared:
$ ls
INCAR  KPOINTS  POSCAR  POTCAR
If you’re on the ISSP supercomputer, let’s use the interactive queue.
$ qsub -queue i18cpu -node 1 -I
Wait a few seconds until you get a prompt, then run vasp (the above can be skipped if you’re on an individually-running work station).
$ mpijob -np 4 PATH_TO_VASP
You should see lines of VASP output and the run should finish within a few seconds.
Calculate eigenvalues along high-symmetry paths in the Brillouin zone
To obtain a k-points path for plotting the band structure, we can use pymatgen, which you will need to install yourself. On ISSP supercomputer system B, this can be done as follows. First set up the python environment provided by the MateriApps team:
$ source /home/issp/materiapps/tool/env.sh
The above should be added to your startup file, e.g., ~/.bashrc. Now, let’s install pymatgen.
$ pip3 install pymatgen --user
Next, prepare a python file make_line_kpoints.py as follows:
from pymatgen.io.vasp.inputs import Kpoints
from pymatgen.core import Structure
from pymatgen.symmetry.bandstructure import HighSymmKpath

struct = Structure.from_file("POSCAR")
kpath = HighSymmKpath(struct)
kpts = Kpoints.automatic_linemode(divisions=40,ibz=kpath)
kpts.write_file("KPOINTS_nsc")
$ python3 make_line_kpoints.py
This results in a file KPOINTS_nsc with k-point line path information based on the AFLOWLIB standard.
Add an option to perform a nonself-consistent calculation to the INCAR file, copy KPOINTS_nsc to KPOINTS, and run vasp.
$ cp KPOINTS_nsc KPOINTS
$ cat INCAR
ISMEAR =  0
SIGMA  =  0.01
GGA    = PE
ICHARG = 11 #Non-SCF
$ mpijob -np 4 PATH_TO_VASP
This should finish within several seconds.
Plot the band structure using pymatgen
(Note: an alternative is to use the GUI program p4vasp, which should be relatively easy if you can get it installed)
To plot the band, prepare a python script “plotband.py” as follows:
from pymatgen.io.vasp.outputs import Vasprun
from pymatgen.electronic_structure.plotter import BSPlotter
vaspout = Vasprun("./vasprun.xml")
bandstr = vaspout.get_band_structure(line_mode=True)
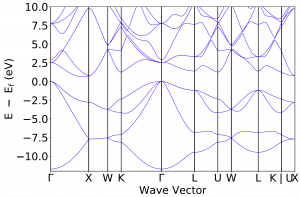
plt = BSPlotter(bandstr).get_plot(ylim=[-12,10])
plt.savefig("band.pdf")
Run this script
$ python3 plotband.py
This results in band.pdf with the following content:
Related reading
- pymatgen
- Examples at vaspwiki
- arXiv:1004.2974 [cond-mat.mtrl-sci] – AFLOWLIB paper presenting standardization of k-paths for band structure plots.